MongoDB Memory Usage, Management, & Requirements

These metrics include cpu usage, etc. Above I show just the memory section. That is:
- resident—amount of actual physical memory (RAM) used by a process.
- virtual—RAM plus memory that has extended to the file system cache, i.e. virtual memory.
- mapped—MongoDB since version 3.2 does not do memory mapping of files anymore. That was used by the previous memory management module called MMAPv1. Now it uses WiredTiger by default.
To check your file system cache run free -k to show available virtual memory in kilobytes. Below is what my server looked like over 5 minute intervals when I ran the machine out of memory. The column to note is available. Divide the number shown by 1024*1024 to convert this number to gigabytes.
$free -k
total used free shared buff/cache available
Mem: 8173744 1088440 6753392 9052 331912 6816176
Swap: 0 0 0
total used free shared buff/cache available
Mem: 8173744 4654600 2663432 9080 855712 3249520
Swap: 0 0 0
total used free shared buff/cache available
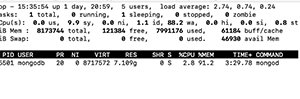
Mem: 8173744 7992568 119508 9052 61668 45682Of course you can use top -p (mongod pid) to monitor memory too. VIRT and RES are virtual and resident memory. Below you see that mongod is using 91% of the system’s memory in this example. At that point the system became unresponsive.
You can also get memory usage statistics from MongoDB in the shell:
db.serverStatus().mem
{
"bits" : 64,
"resident" : 907,
"virtual" : 1897,
"supported" : true,
"mapped" : 0,
"mappedWithJournal" : 0
}
If you have even done C or C++ programming you will be familiar with malloc. That is the system function you call when you need to reserve memory for your machine. When MongoDB can no longer do that these warnings start showing up in /var/log/mongodb/mongod.log:
2019-02-19T03:44:18.738+0000 I COMMAND [ftdc] serverStatus was very slow: { after basic: 202, after asserts: 686, after backgroundFlushing: 890, after connections: 1399, after dur: 1717, after extra_info: 2039, after freeMonitoring: 3003, after globalLock: 3389, after locks: 4073, after logicalSessionRecordCache: 4782, after network: 5520, after opLatencies: 6068, after opcounters: 6477, after opcountersRepl: 6818, after repl: 7441, after security: 7799, after storageEngine: 8616, after tcmalloc: 9676, after transactions: 10081, after transportSecurity: 10412, after wiredTiger: 22733, at end: 24170 }
Until it finally says:
2019-02-19T03:45:17.456+0000 F - [free_mon] out of memory.
You can also log into mongo and repeat the two commands below (you need to execute both to update the output) to watch your memory usage spike as your server goes downhill.
var mem = db.serverStatus().tcmalloc;
mem.tcmalloc.formattedString
Here is the output. As you can see it has exhausted all the available memory on this 8GB machine.You can also log into mongo and repeat the two commands below (you need to execute both to update the output) to watch your memory usage spike as your server goes downhill.
------------------------------------------------
MALLOC:       73048776 (   69.7 MiB) Bytes in use by application
MALLOC: +      3792896 (    3.6 MiB) Bytes in page heap freelist
MALLOC: +       508776 (    0.5 MiB) Bytes in central cache freelist
MALLOC: +       978848 (    0.9 MiB) Bytes in transfer cache freelist
MALLOC: +      1399344 (    1.3 MiB) Bytes in thread cache freelists
MALLOC: +      1335552 (    1.3 MiB) Bytes in malloc metadata
MALLOC:   ------------
MALLOC: =     81064192 (   77.3 MiB) Actual memory used (physical + swap)
MALLOC: +            0 (    0.0 MiB) Bytes released to OS (aka unmapped)
MALLOC:   ------------
MALLOC: =     81064192 (   77.3 MiB) Virtual address space used
MALLOC:
MALLOC:            816              Spans in use
MALLOC:             21              Thread heaps in use
MALLOC:           4096              Tcmalloc page size
------------------------------------------------
You can also log into mongo and repeat the two commands below (you need to execute both to update the output) to watch your memory usage spike as your server goes downhill.
Useful Commands:
db.getCollectionNames().map(name => ({totalIndexSize: db.getCollection(name).stats().totalIndexSize, name: name})).sort((a, b) => a.totalIndexSize - b.totalIndexSize).forEach(printjson)
db.serverStatus().mem # show resident memory and virtual db.vehicledetails.latencyStats() # show latency for read and write ops
db.serverStatus() #in this u can see warning and asserts
db.vehicledetails.dataSize()
db.vehicledetails.storageSize()
db.vehicledetails.totalSize()
db.vehicledetails.totalIndexSize()